

Once you have created a Personalized or pURL Campaign, you’ll want to view reports to see how your audience is responding in terms of opens, clicks and conversions. To view reports for any pURL campaign associated with your account, follow these steps:
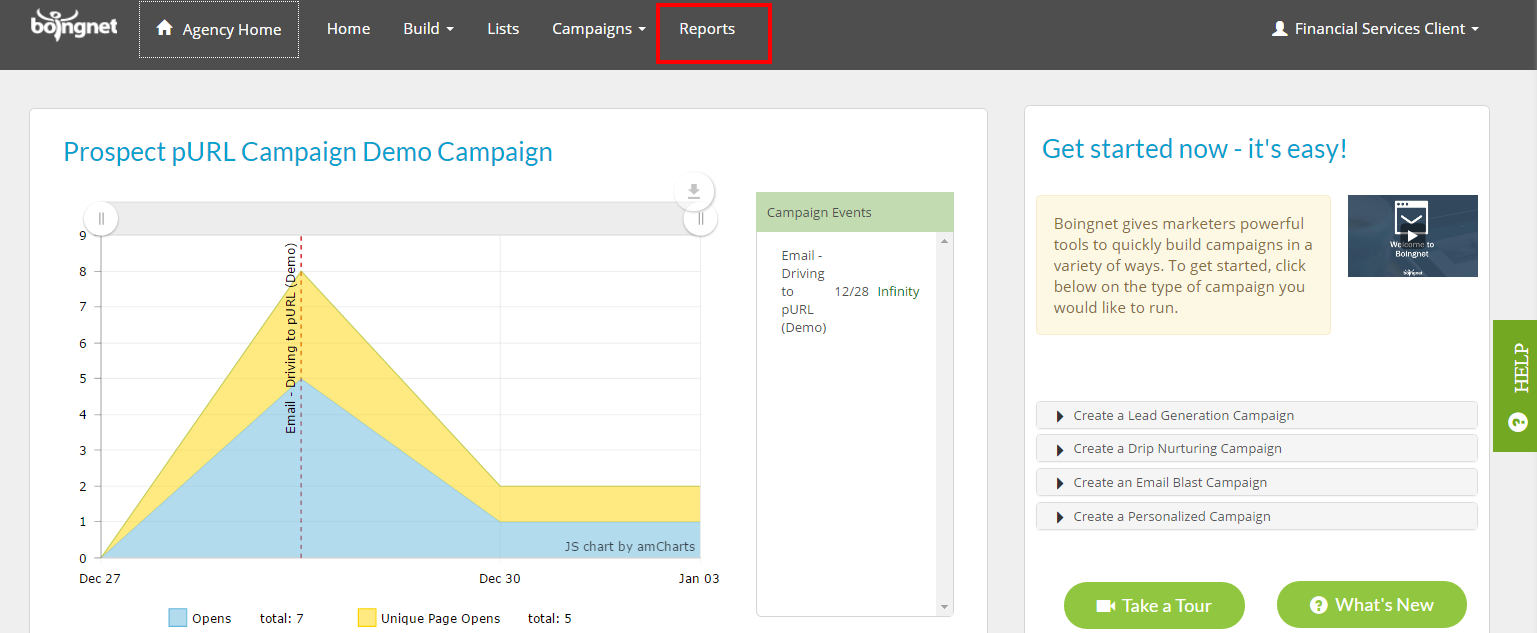
- From the main navigation bar, click on Reports:
Next, select View pURL Reports:
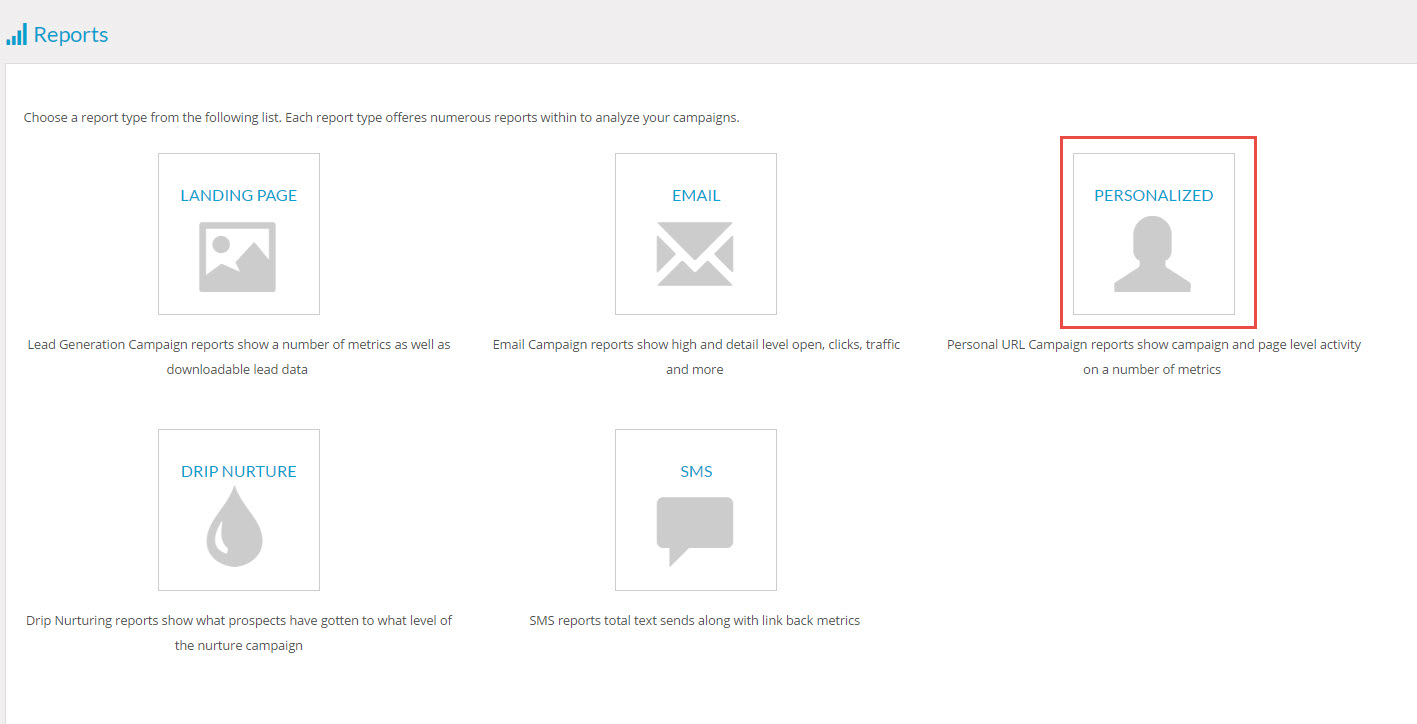
Next, select the type of pURL Report that you’d like to view:
The Overview Report
This is the most comprehensive pURL report, it shows you totals of activity at the campaign or the page level:
To access the Overview Report:
- Click the Overview Tab
- Select the campaign from the drop down menu
- Select the Granularity Level – Campaign or Page
- Click View Report:
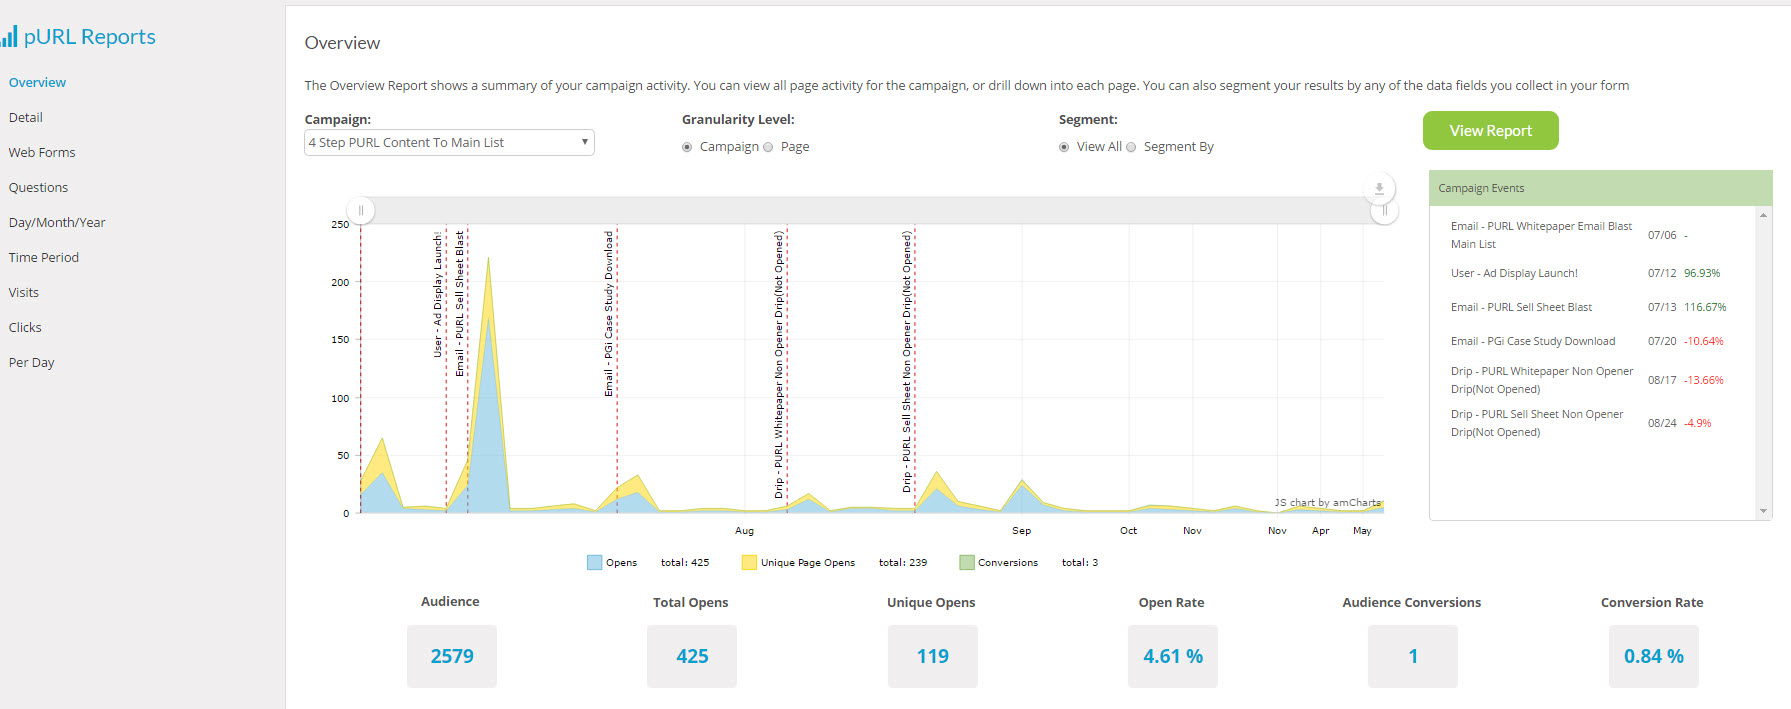
Audience – This number represents the number of individuals included in this campaign.
Opens – This represents the total number of individuals that viewed this page of the campaign.
Unique Opens – This represents the number of individuals who opened this page one time. If someone visited this page 20 times, it would only be counted as 1 unique visit.
Open Rate – This is the number of unique opens divided by total opens.
Conversions – This represents the number of people who clicked through this page.
Conversion Rate – This is the number of conversions divided by the number of opens.
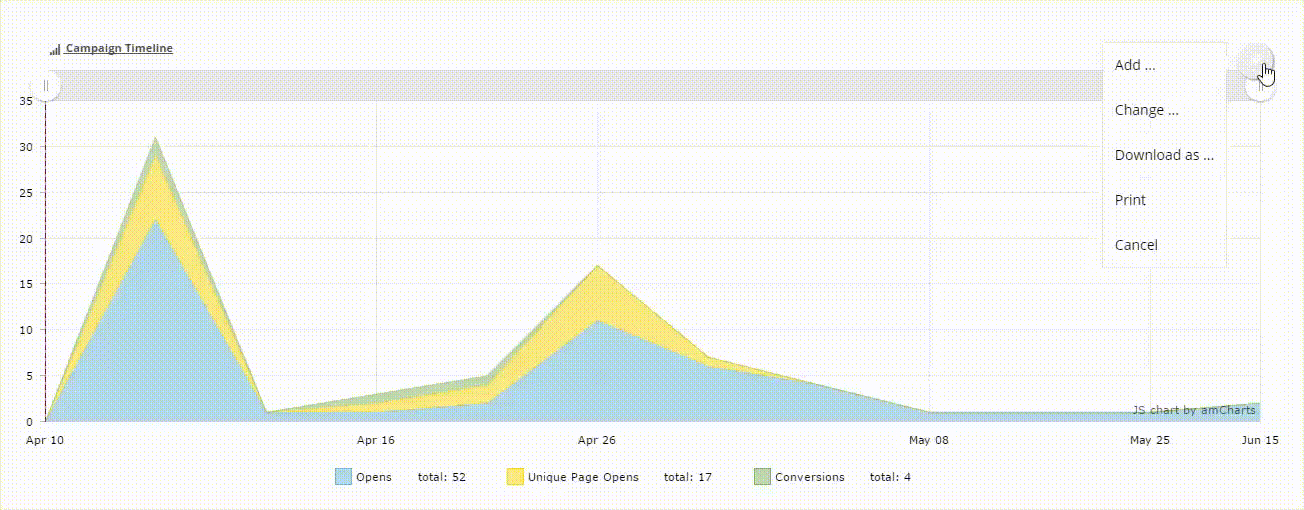
To download, print or annotate the chart with text or shapes, select the pencil icon as in the below animation:
Enhance, Download or Print Your Chart
The Detail Report
This report shows you all of the relevant information pertaining to your pURL visitors. You can narrow the results with search criteria:
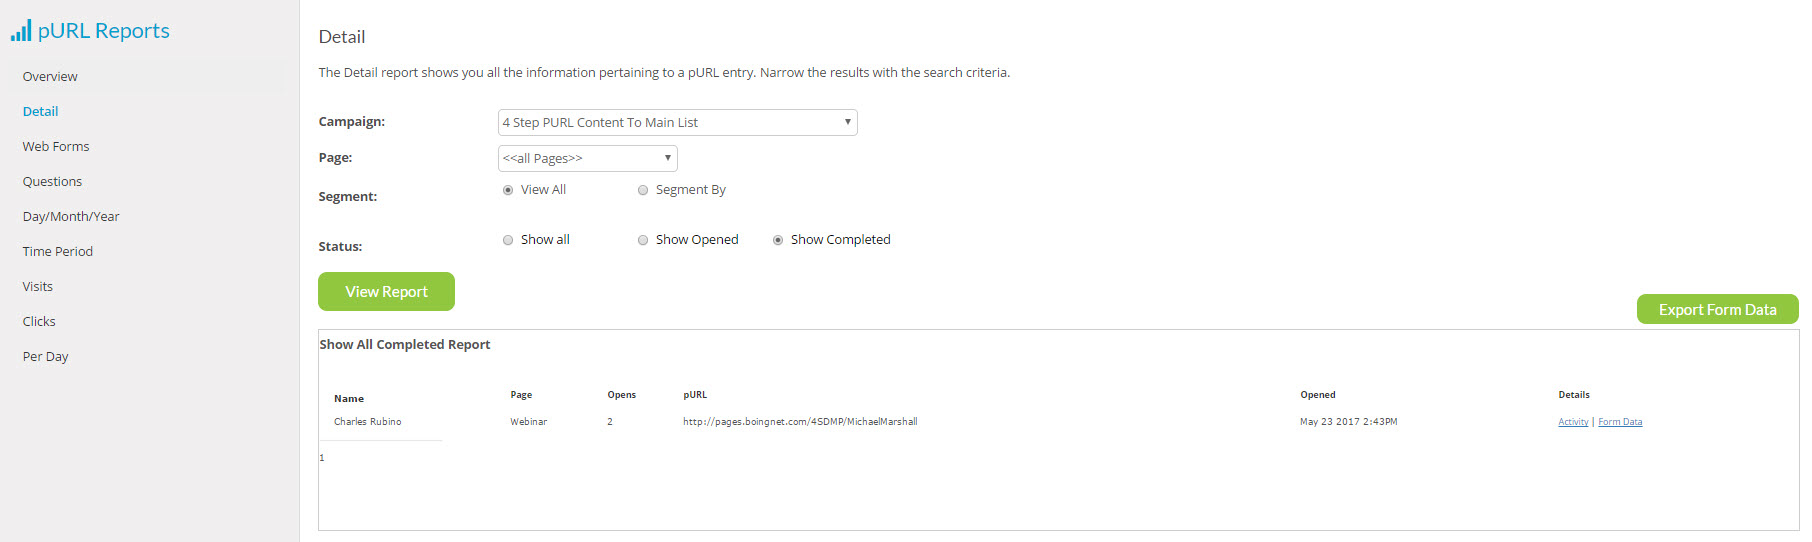
To access the Detail Report:
- Click the Detail Tab
- Select the campaign from the drop down menu
- Select View All or Segment By
- If you choose Segment By, you must select the data field to use from the drop down menu and enter the data field value in the box to the right.
- Select Status by clicking either Show All, Show Opened, or Show Completed.
- Click View Report
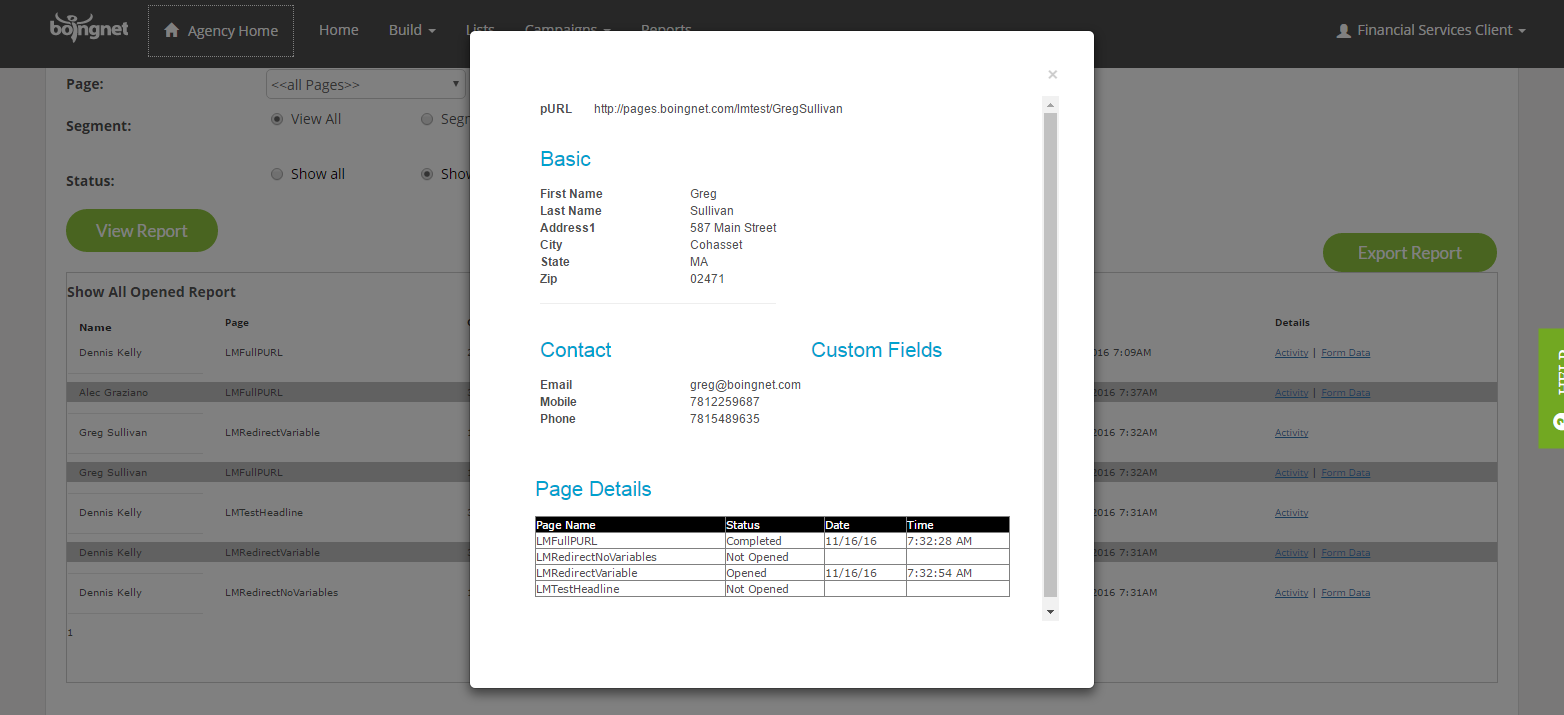
Click on Activity underneath Details to see detailed information, such as the page name, status and date and time opened for a particular contact:
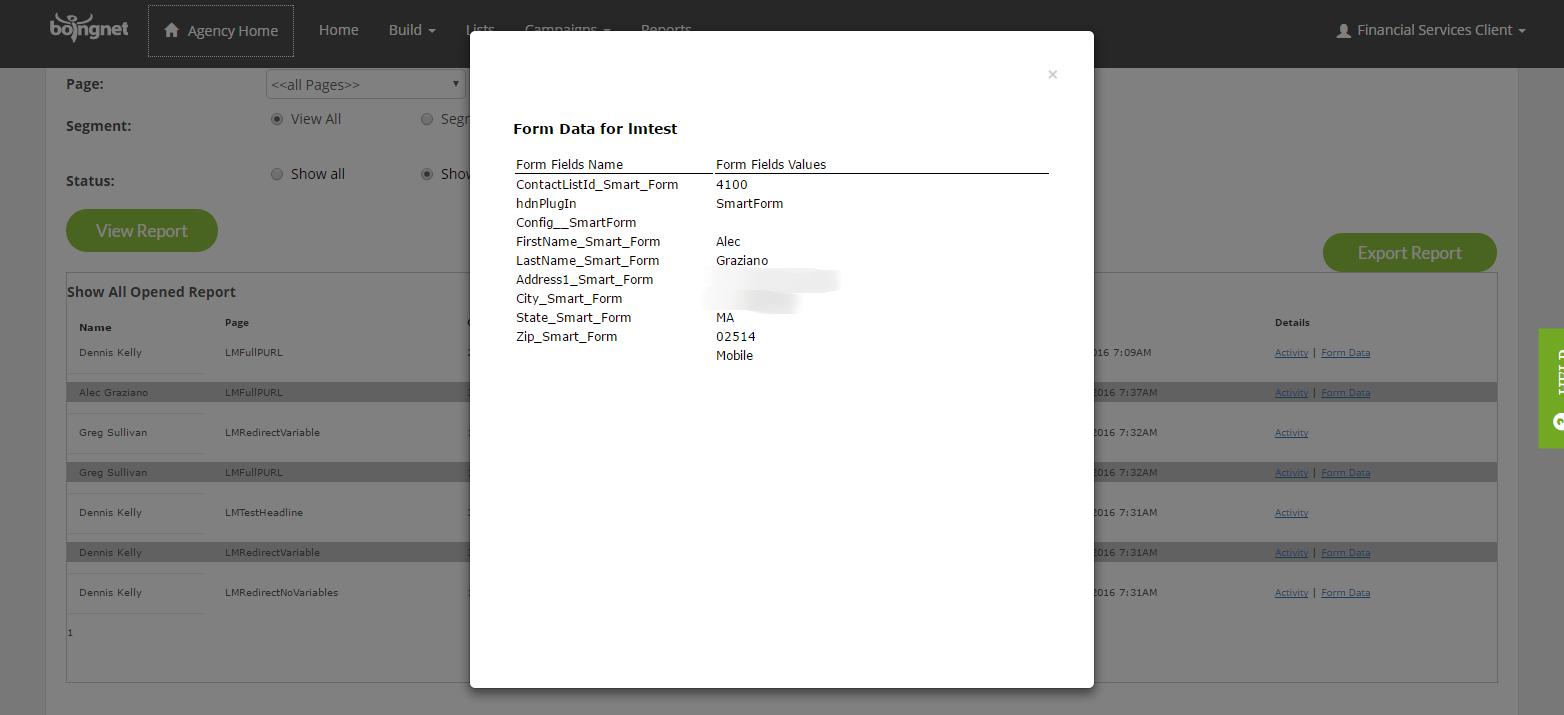
Click on Form Data under Details to see the form data entered on a particular pURL:
The Web Forms Report
This report shows you to export user submitted data from any forms in your campaign:
To access the Web Forms Report:
- Click on the Web Forms Tab
- Select the Campaign you’d like to view from the drop down menu
- Select the Page from the drop down menu
- Click Export Form Data
This will generate a csv file of all web form data for the campaign selected.
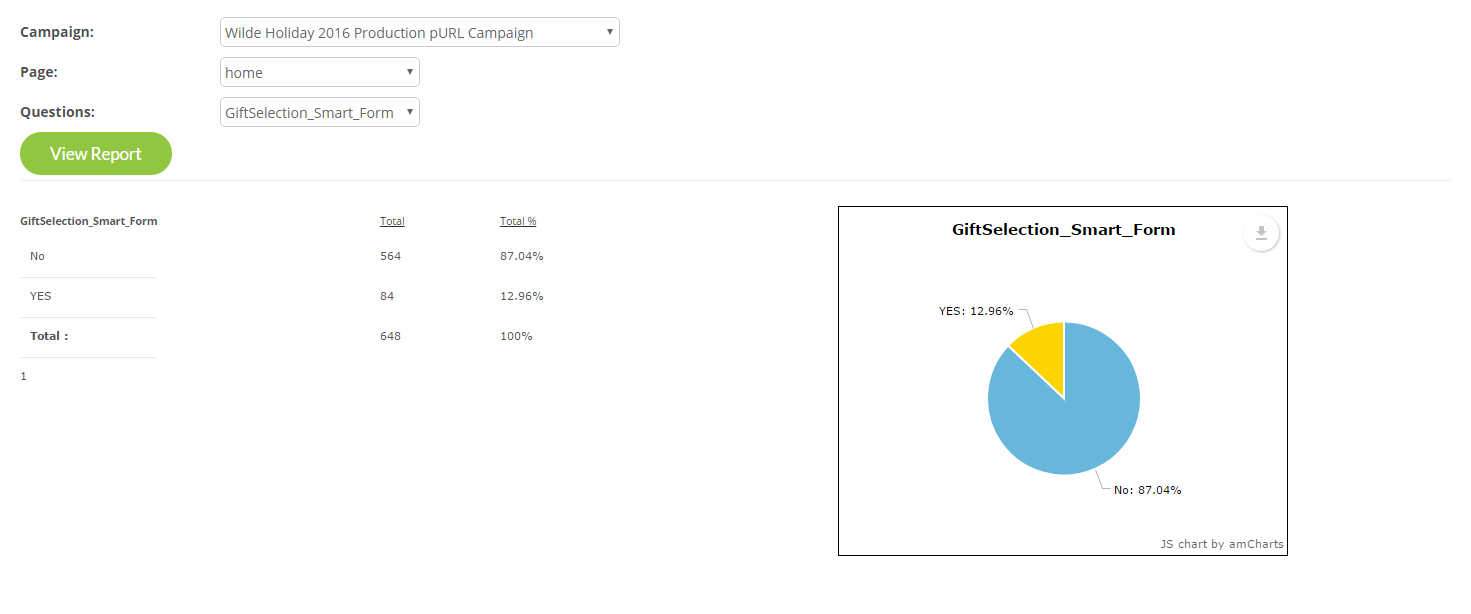
The Questions Report
This report allows you to get summary data for answers to finite form questions. For a full set of form questions and answers, use the Web Forms Report:
To access the Questions Report:
- Select the Questions tab at top of page.
- Select the Campaign you’d like to view from the drop down menu
- Select the Page from the drop down menu.
- Select the Question from the drop down menu.
- Click View Report:
This will display a graph of the data for the question you selected:
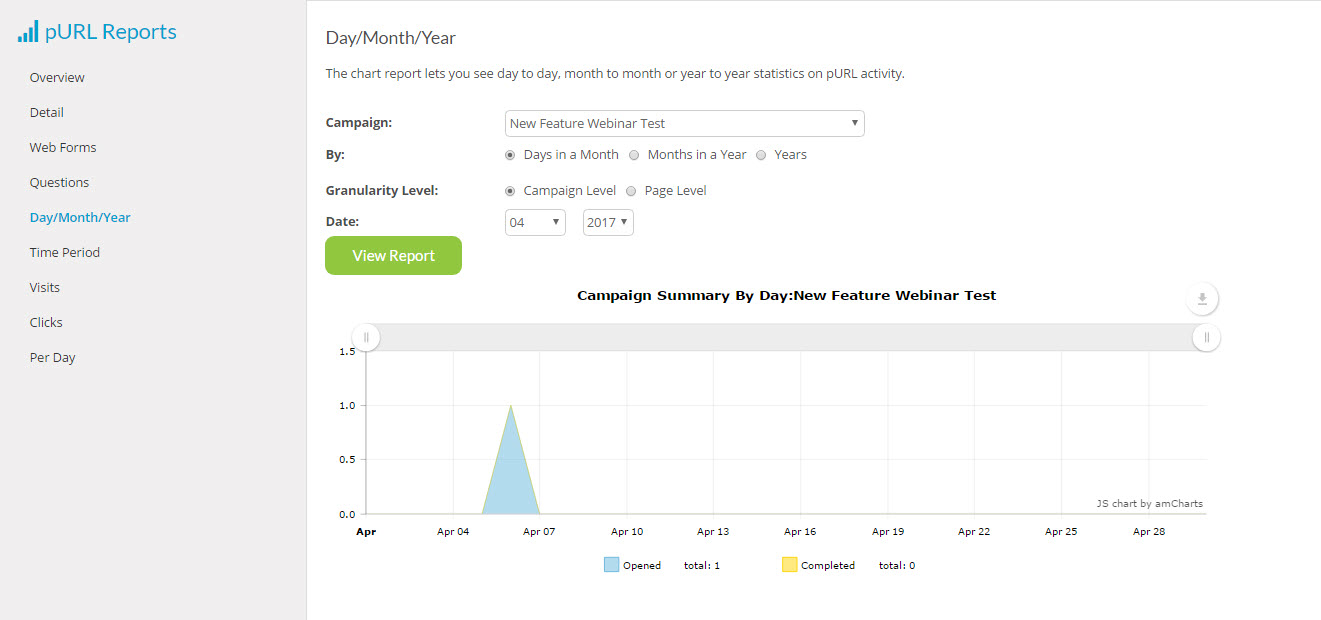
The Day, Month, Year Report
This report allows you to see URL activity by day, month, or year:
To access the Day Month Year Report:
- Select the Day/Month/Year tab at top of page.
- Select the Campaign you’d like to view from the drop down menu.
- Select either Days in a Month, Months in a Year or Years.
- Select either Campaign Level or Page Level.
- Select the Date for your report.
- Click View Report:
Time Period Report
This report allows you to compare metrics, such as URL visits, from different time periods:
To access the Time Period Report:
- Select the Campaign you’d like to view from the drop down menu
- Select the Page from the drop down menu
- Enter the time frames you’d like to compare in Period One and Period Two.
- Click View Report:
A chart and a graph of the campaign’s data for the time period entered will display:
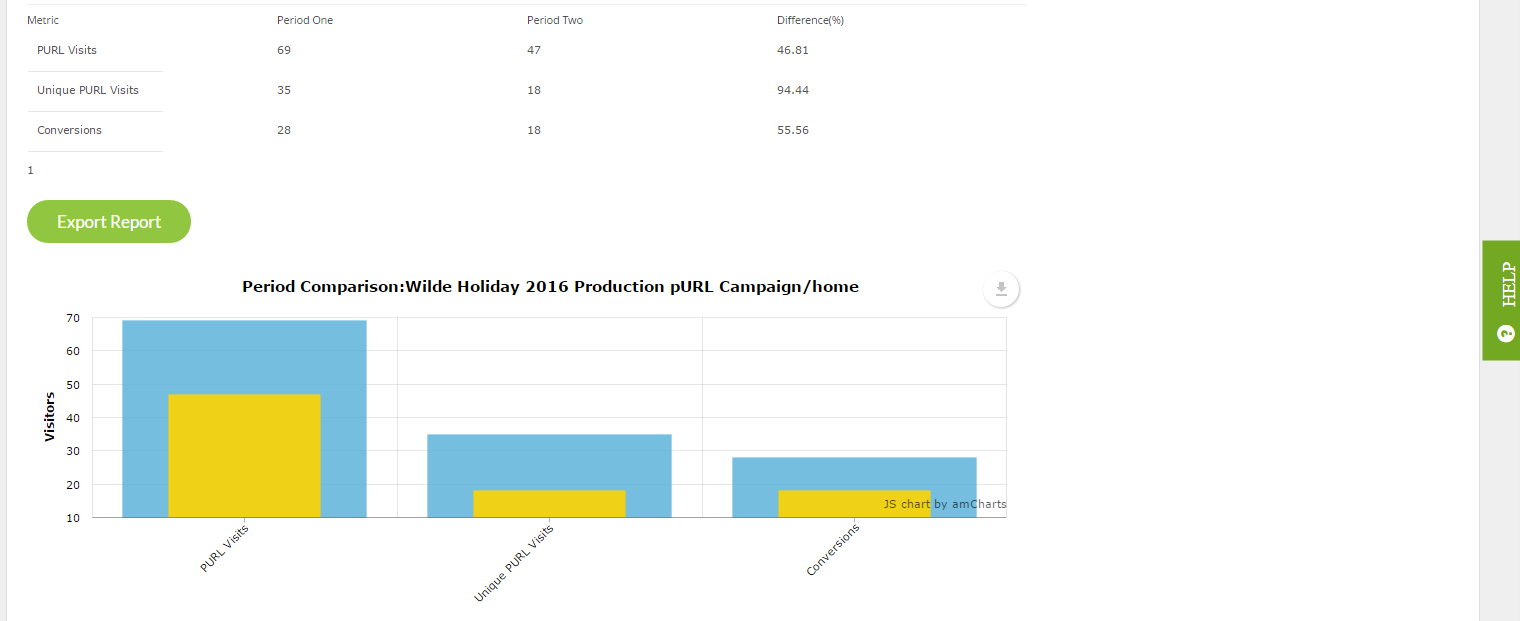
You can export this data into a csv file by clicking the Export Report button.
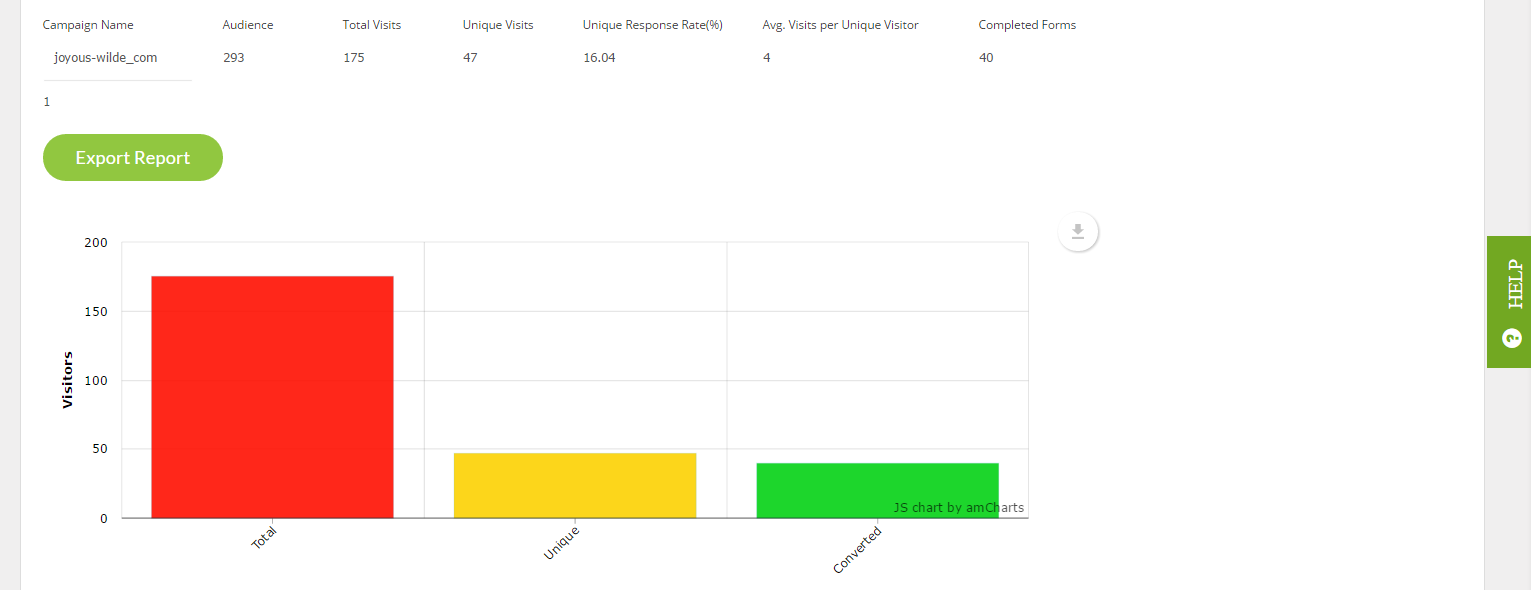
The Visits Report
This report allows you to view key campaign metrics – visits, unique visits and conversions by campaign or campaign group.
To access the Visits Report:
- Select the Visits tab at top of page.
- Select the Group and /or the Campaign from the drop down menu.
- Click View Report.
A chart and a graph of the visits data for the campaign selected will display:
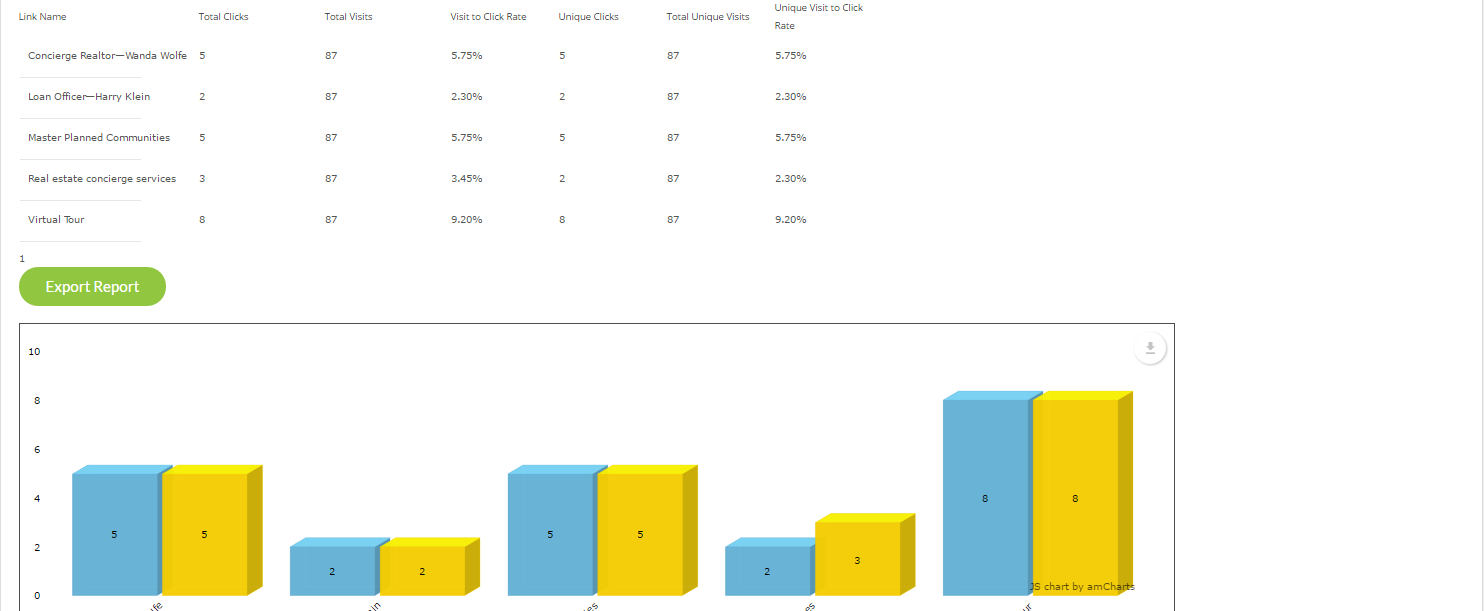
The Clicks Report
This report shows you a summary of clicks on all links you have on your campaign’s templates. This report can be viewed at the campaign or page level.
To access the Clicks Report:
- Select Clicks on tab at top of page.
- Select Campaign, Page and Link Names in the drop down menus provided.
- Click View Report:
The Per Day Report
This report shows you a summary of daily visits for the time period you select.
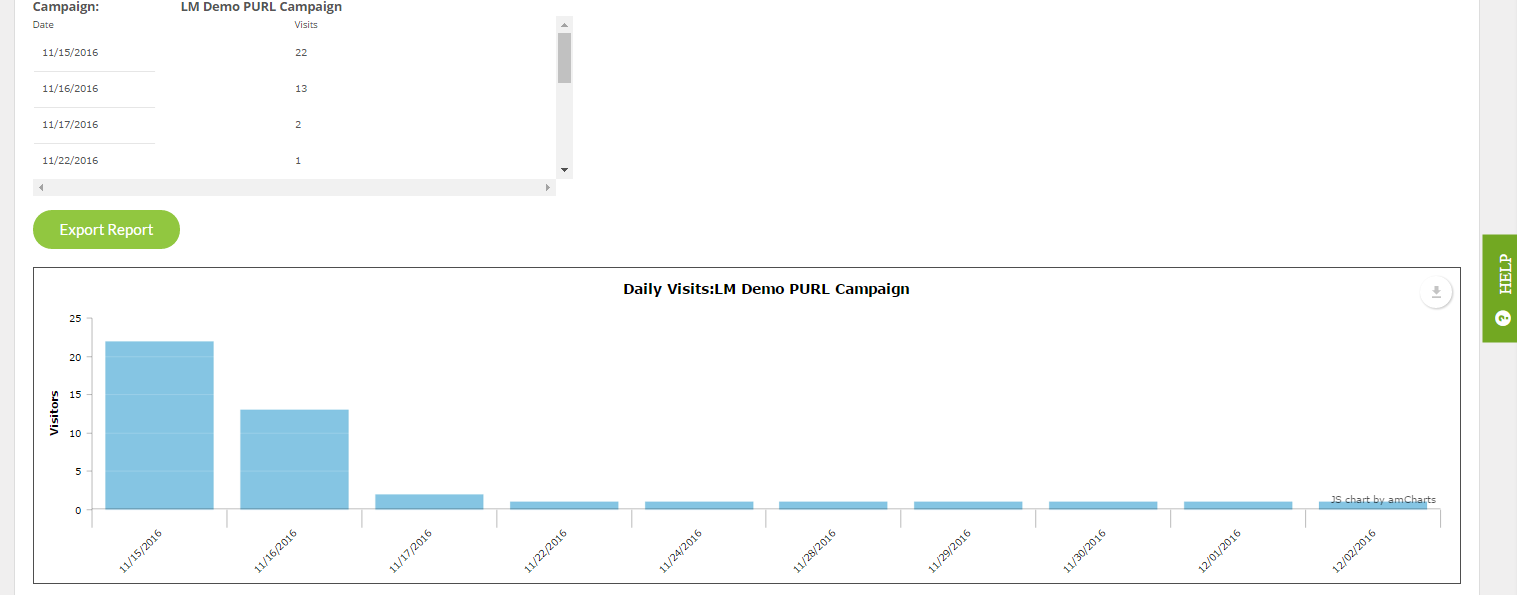
To View the Per Day Report:
- Select Per Day on the tab at the top of page.
- Select Campaign from the drop down menu.
- Select the day or days to include in the report.
- Click View Report
- If you want to download the data, click Export Report and a csv file will be downloaded.
Contact Our Support Forums for Help
We are perpetually seeking to evolve our product as well as our support process. If you didn't find your answer here take a moment to visit our support forums as well as submit your ideas on how we can bring Boingnet to the next level!
Support Forums